Making trading decisions and developing a sound, effective strategy is one of the most important foundations of trading. Before working through these examples, it helps to have a working knowledge of technical analysis terminology — covered in the Glossary.
Any trading strategy should have a disciplined method of limiting risk while making the most out of favorable market moves. We'll walk through two foundational strategies. These aren't the only ones — they're starting points to research and adapt as you develop your own approach.
Strategy 1Simple Moving Average crossover
A trend-following system using the 12-period SMA on a 15-minute chart.
This is a "Stop and Reverse" (SAR) system: every signal closes the current position and opens the opposite. The trader is therefore always in the market — either long or short — after the first signal fires.
"Always in" doesn't mean "always winning." The system trades both directions. In choppy, sideways markets, SMA crossover strategies can generate many false signals back-to-back — small losses each time. They work best in clearly trending markets. Knowing when not to apply a strategy is as important as knowing how to apply it.
Worked example
In the chart below, the white line represents the price of EUR/USD, the purple line represents the 12-period SMA, and the red line indicates where price crosses above the SMA — generating a buy signal at approximately 1.2780:
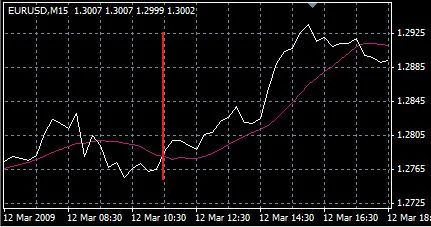
This is a simple illustration of technical analysis applied to trading. Many strategies used by professional traders combine moving averages with other indicators or "filters" to reduce false signals.
Note that the moving average method has built-in risk control: a long position will be stopped out fairly quickly in a falling market because price drops below the SMA, generating a stop-and-reverse signal. The same holds true for a sell signal in a rising market — the trader is never far from the exit.
Strategy 2Support & resistance levels
A levels-based system using historical price action to find high-probability entries.
A different use of technical analysis — apart from formal indicators — is identifying support and resistance levels. The concept:
Price tends to bounce up off support levels. If support breaks, expect continued downside.
Price tends to retreat from resistance. If resistance breaks, expect continued upside.
These levels are identified by analyzing the chart and assessing where price has encountered unbroken support or resistance in the past — usually multiple times.
Worked example
In the chart below, EUR/USD has established a resistance level at approximately 1.3970. The price has risen to that level repeatedly but been unable to move beyond it:
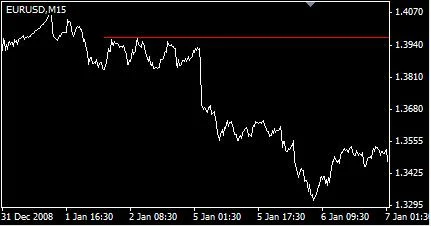
The trade setup
The strategy would be to sell EUR/USD the next time it approaches 1.3970, placing a stop just above the resistance (say 1.3985). This would have been a good trade — EUR/USD proceeded to fall sharply after failing to break 1.3970.
This is the entire point of trading near support/resistance: you risk a small, well-defined amount in exchange for a potentially much larger move. Even if only 1 in 3 of these setups works, you still come out ahead.
From example to system
Both of the strategies above are starting points. A real trading system answers four questions before any trade is placed:
Strategy 1 (SMA) answers questions 1, 2, and 3 mechanically. Strategy 2 (S/R) answers 1, 2, and 3 with chart analysis. Neither answers question 4 — that's risk management, and it's the topic of the next lesson.
Lesson recap
- A trading strategy is a repeatable set of rules for entering and exiting positions — not a one-time hunch.
- SMA crossover is a mechanical trend-following system: buy above the SMA, sell below it. Best in trending markets, weak in choppy ones.
- Support & resistance trading risks a small, known amount near a key level for a potentially much larger reward.
- Both strategies illustrated have built-in stop logic — losses are capped automatically.
- A complete trading system has four parts: entry, profit exit, loss exit, and position size. Strategy covers the first three; risk management covers the fourth.
A strategy without risk management is just a bet
The next lesson covers position sizing, stop placement, and how to survive the inevitable losing streaks.
Test these strategies risk-free
A demo account lets you place real trades with virtual money on live prices.
Open Free DemoGCI's platforms (cTrader, MT4/5, ActTrader) all include built-in SMA, support/resistance, and dozens of other indicators.
See platformsQuestions about strategy?
Talk to a real specialist — multilingual support 24/7.
You've finished Lesson 03
You now have two real strategies. The final lesson covers how to manage the inevitable losses that come with any trading system.