5 Reasons Why USD is Tanking. USD & AUD Interest Rates this Week.
Pullback on all Precious Metals! Gold XAUUSD Still Above $5,000 and Silver Still Above $100.
In today’s GCI Market Outlook, let’s take a look at Forex Trading on the NASDAQ, Gold, XAUUSD, Silver, XAGUSD, USDJPY and GBPUSD.
Just a reminder that these videos are intended as educational, we are only observing current market conditions, and these are not to be considered as trading advice.
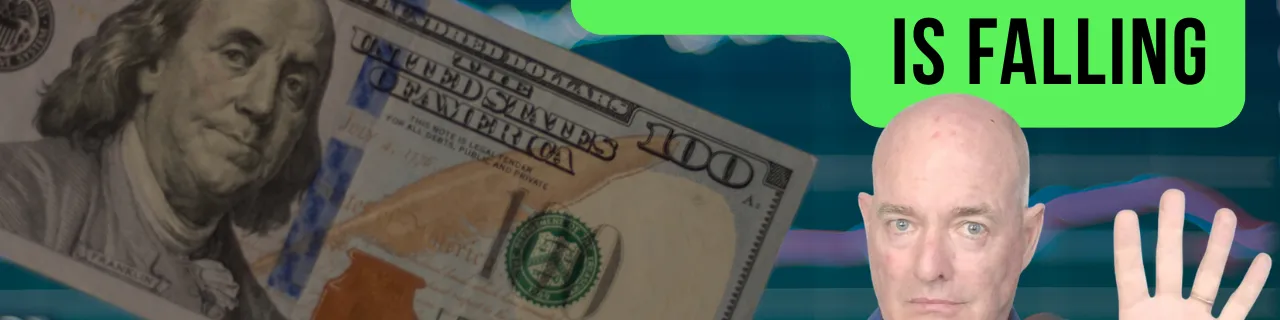
This week, USD has taken a big hit, and there are many reasons for this.
Firstly, after Davos last week and months of crazy tariffs, global economies are now considering US debt, US policies, and general political chaos to be too risky, and many are dumping US debt instruments.
Secondly, stronger performances by other currencies like GBP and JPY are outperforming USD.
Thirdly, there is a lot of speculation that most other central banks will adjust monetary policy to distance themselves from the US.
Fourthly, many investors are looking for safe havens away from USD, like Gold, and we will come back to that.
Fifthly, there is still speculation that the Fed will lower interest rates sometime this year.
We see that the prediction for Wednesday includes no rate change, but the FOMC Statement and Press Conference will tell us a lot more.
Also, we see CPI from Australia, an interest rate decision and GDP from Canada, and PPI from the US.
We see that AUD is quite strong at the moment against many currencies.
If the news gives us a pullback, against the trend, we then have an opportunity to trade with the trend.
We saw price action across all precious metals, not just gold and silver, pull back with a bit of profit-taking.
However, we are still over $5,000 and $100, respectively.
This profit-taking was shifted into a risk-on mood in the stock markets as the NASDAQ, for example, is heading back to record highs.
You will note that we often use MACD as a technical indicator.
MACD stands for Moving Average Convergence Divergence and cTrader has 2 different types.
Under Indicators, Oscillators, you have MACD Histogram which shows us a bearish and bullish histogram and a signal line.
When the histogram passes above or below the zero line, we may expect sustained price action on that respective side.
When the signal line passes out of the histogram, we may expect a reversal.
On MACD Crossover, we have a less pronounced histogram but 2 moving averages to indicate reversals.
That’s all for now.
CFDs and FX are leveraged products, and your capital may be at risk.
Latest Analysis
- Gold XAUUSD at Resistance! Brent Crude Triangle & Fed Rate Outlook | Forex Trading Yesterday 04:24 AM
- Dow Jones Recovery? 4 Key Factors to Watch | US CPI, NASDAQ Resistance & Forex Outlook October 14, 2026 06:18 AM
- Brent Crude Oil Surges on Hormuz Attacks | Dow Jones Weakness, Gold & Forex Outlook October 08, 2026 04:45 AM
- Gold XAUUSD in Descending Triangle & 4 Reasons for USD Strength | WTI vs Brent October 06, 2026 04:33 AM
- NFP Trading: How to Trade the US Non-Farm Payrolls | Gold XAUUSD & USD Outlook October 01, 2026 05:31 AM
- US Indices Under Pressure: 5 Problems to Watch | AUD CPI, USD Strength & Gold Outlook September 29, 2026 04:59 AM
- WTI & Brent Crude Bearish: Real Drop or Fakeout? | US Indices, Gold & Silver Outlook September 24, 2026 04:34 AM
- USD So Strong? 4 Key Reasons | AUDCAD, Gold XAUUSD & Forex Outlook September 22, 2026 03:59 AM
- Brent Crude Oil Drops: 5 Reasons Why | Fed Rate Hike, Gold, GBPJPY & BoJ Outlook Today 05:04 AM
- NZDUSD Bearish Outlook: 4 Reasons to Watch | Fed Rate Decision, USD Strength & NASDAQ September 15, 2026 06:21 AM
Open an account in minutes
Trade on our award-winning platforms with ultra-fast and ultra-secure execution.
OPEN AN ACCOUNT