GOLD & SILVER BEARISH? EUR GAPS DOWN!
Dow Jones Industrial Average Higher Despite High Crude Prices. US Midterms Looming!

Good day, Team GCI.
In our last video, we spotted gold continuing its bear run at price action at the upper trend line.
True to form, price did in fact bounce off and continue lower, and gave us a double top as well.
In today’s Market Outlook, let’s take a look at Forex trading on the NASDAQ, S&P 500, the Dow Jones Industrial Average, WTI, EURUSD, Silver, XAGUSD, and Gold, XAUUSD.
Just a reminder that these videos are intended as observational and educational, and are not to be considered as trading advice.
But are we seeing a descending triangle on gold?
If we move out to the daily chart, we can clearly see that triangle with support at around $4,100…a nice round number.
We see the next key level below at $4,000…an even rounder number, and a previous descending triangle which broke out to the upside.
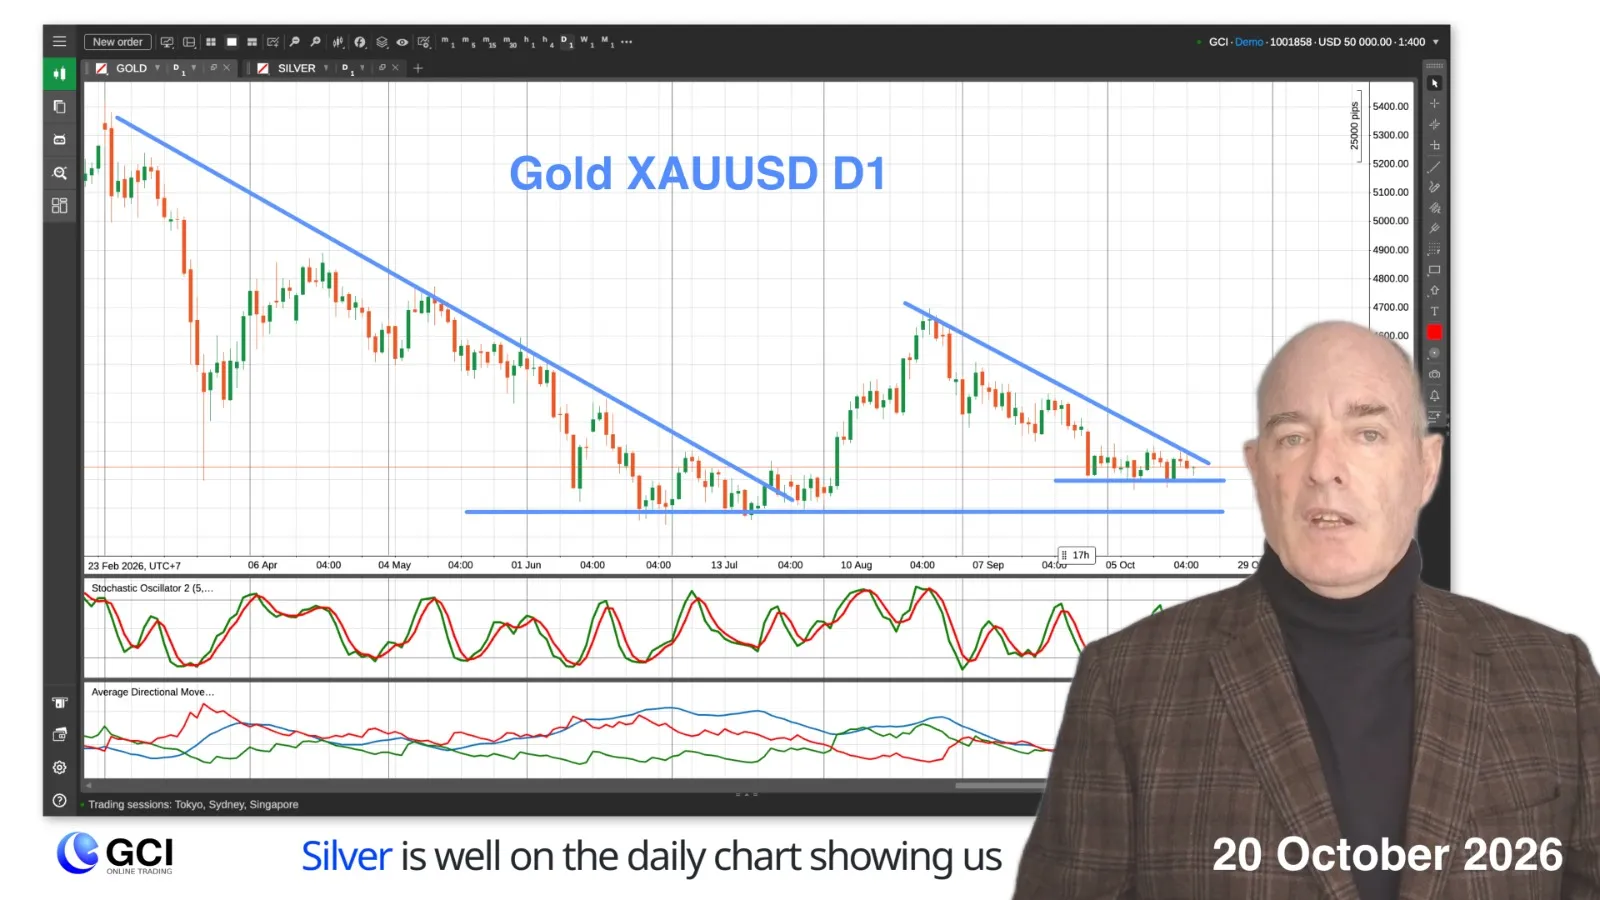
Silver, as well, on the daily chart, is showing us the same pattern with resistance at $55.50.
As we have been saying for weeks, this has more to do with the strength of USD even though the expectations are that the Fed will hold interest rates steady this month.
At yesterday’s open, we saw EURUSD gap to the downside but the gap was filled quite quickly…within 2 hours.
There is a saying in trading: “Gaps always get filled.”
Is this true? Not always so let’s take a look.
On EURJPY the gap was filled in 5 hours.
On EURNZD, 7 hours, then the downtrend continued.
On EURCHF, 4 hours.
On EURGBP, 8 hours.
But on EURAUD, it did not get filled…why is that?
We can see from the 4-hour chart that the gap jumped over a key level of previous resistance and fell to a key level of support, so we will keep an eye on these levels.
And what can we say about the price of crude oil as we see the steady march higher with WTI reaching $100 per barrel?
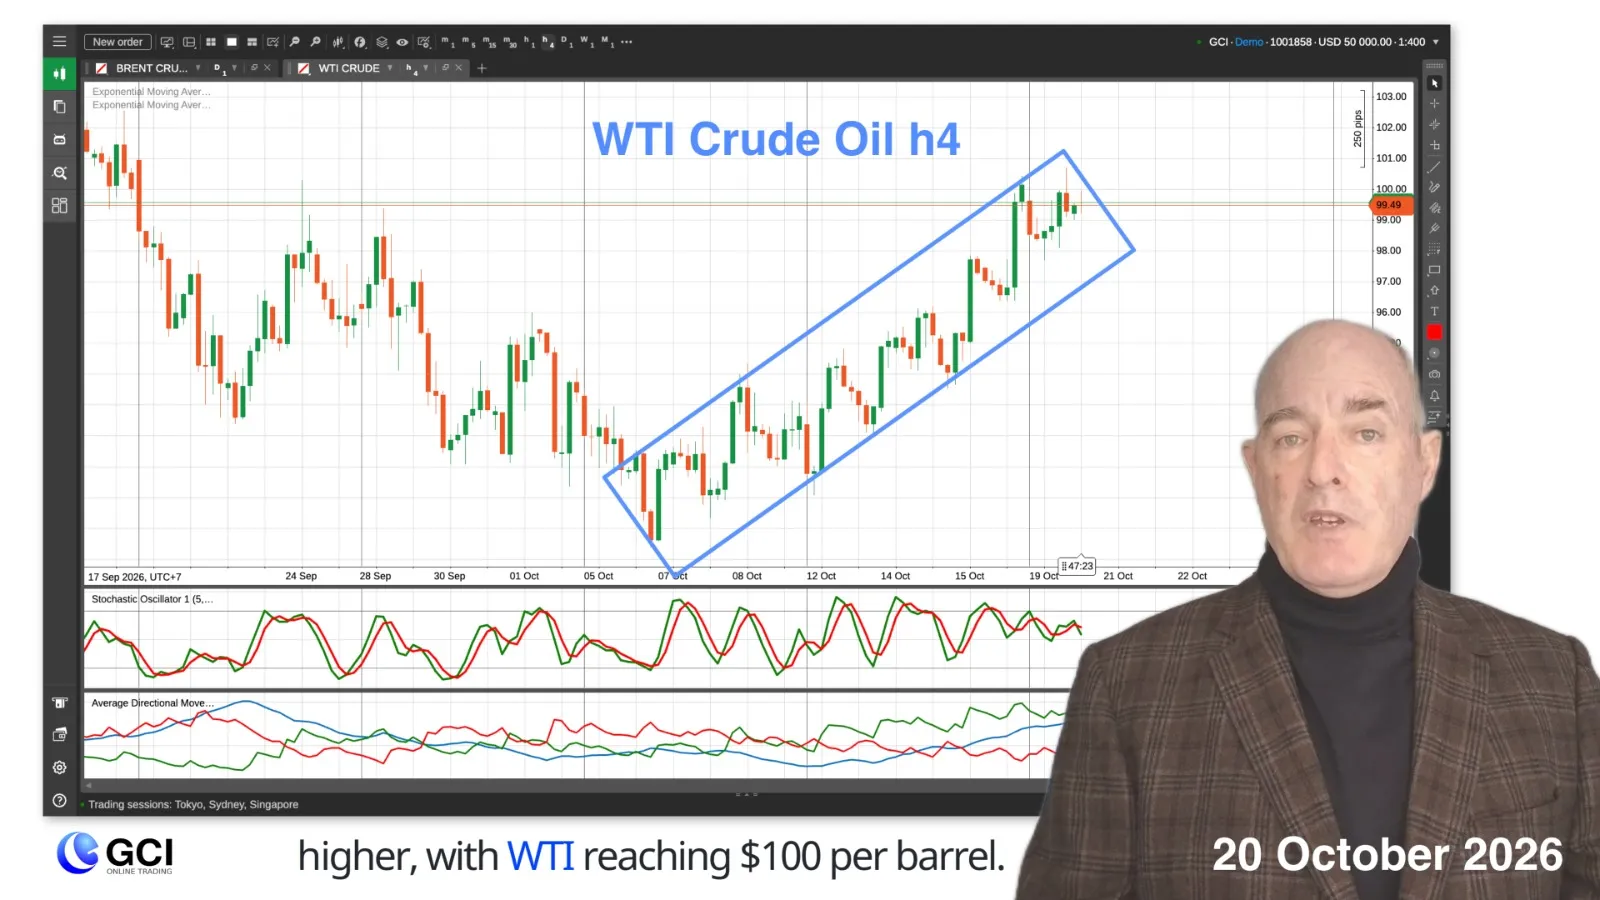
The bottom line on price here, and with Brent Crude, is that good news from the Middle East will see prices fall, and more bad news will see prices rise.
Contrary to recent investor sentiment, we see the NASDAQ and S&P500 falling while the Dow Jones Industrial Average is rising.
Why is that?
This is clearly a market rotation away from AI and tech stocks, which fall in and out of favour every few weeks, and the upcoming US midterm elections.
Basically, if Republicans lose control of Congress, large tech companies will be under much more scrutiny, spooking investors.
That’s all for now.
CFDs and FX are leveraged products, and your capital may be at risk.
Latest Analysis
- GOLD & SILVER BEARISH? EUR GAPS DOWN! Today 03:58 AM
- Gold XAUUSD at Resistance! Brent Crude Triangle & Fed Rate Outlook | Forex Trading October 16, 2026 04:24 AM
- Dow Jones Recovery? 4 Key Factors to Watch | US CPI, NASDAQ Resistance & Forex Outlook October 14, 2026 06:18 AM
- Brent Crude Oil Surges on Hormuz Attacks | Dow Jones Weakness, Gold & Forex Outlook October 08, 2026 04:45 AM
- Gold XAUUSD in Descending Triangle & 4 Reasons for USD Strength | WTI vs Brent October 06, 2026 04:33 AM
- NFP Trading: How to Trade the US Non-Farm Payrolls | Gold XAUUSD & USD Outlook October 01, 2026 05:31 AM
- US Indices Under Pressure: 5 Problems to Watch | AUD CPI, USD Strength & Gold Outlook September 29, 2026 04:59 AM
- WTI & Brent Crude Bearish: Real Drop or Fakeout? | US Indices, Gold & Silver Outlook September 24, 2026 04:34 AM
- USD So Strong? 4 Key Reasons | AUDCAD, Gold XAUUSD & Forex Outlook September 22, 2026 03:59 AM
- Brent Crude Oil Drops: 5 Reasons Why | Fed Rate Hike, Gold, GBPJPY & BoJ Outlook September 17, 2026 05:04 AM
Open an account in minutes
Trade on our award-winning platforms with ultra-fast and ultra-secure execution.
OPEN AN ACCOUNT