Gold XAUUSD in Descending Triangle & 4 Reasons for USD Strength | WTI vs Brent
Brent WTI Spread at $14 but Can We Trade This?

Good day, Team GCI.
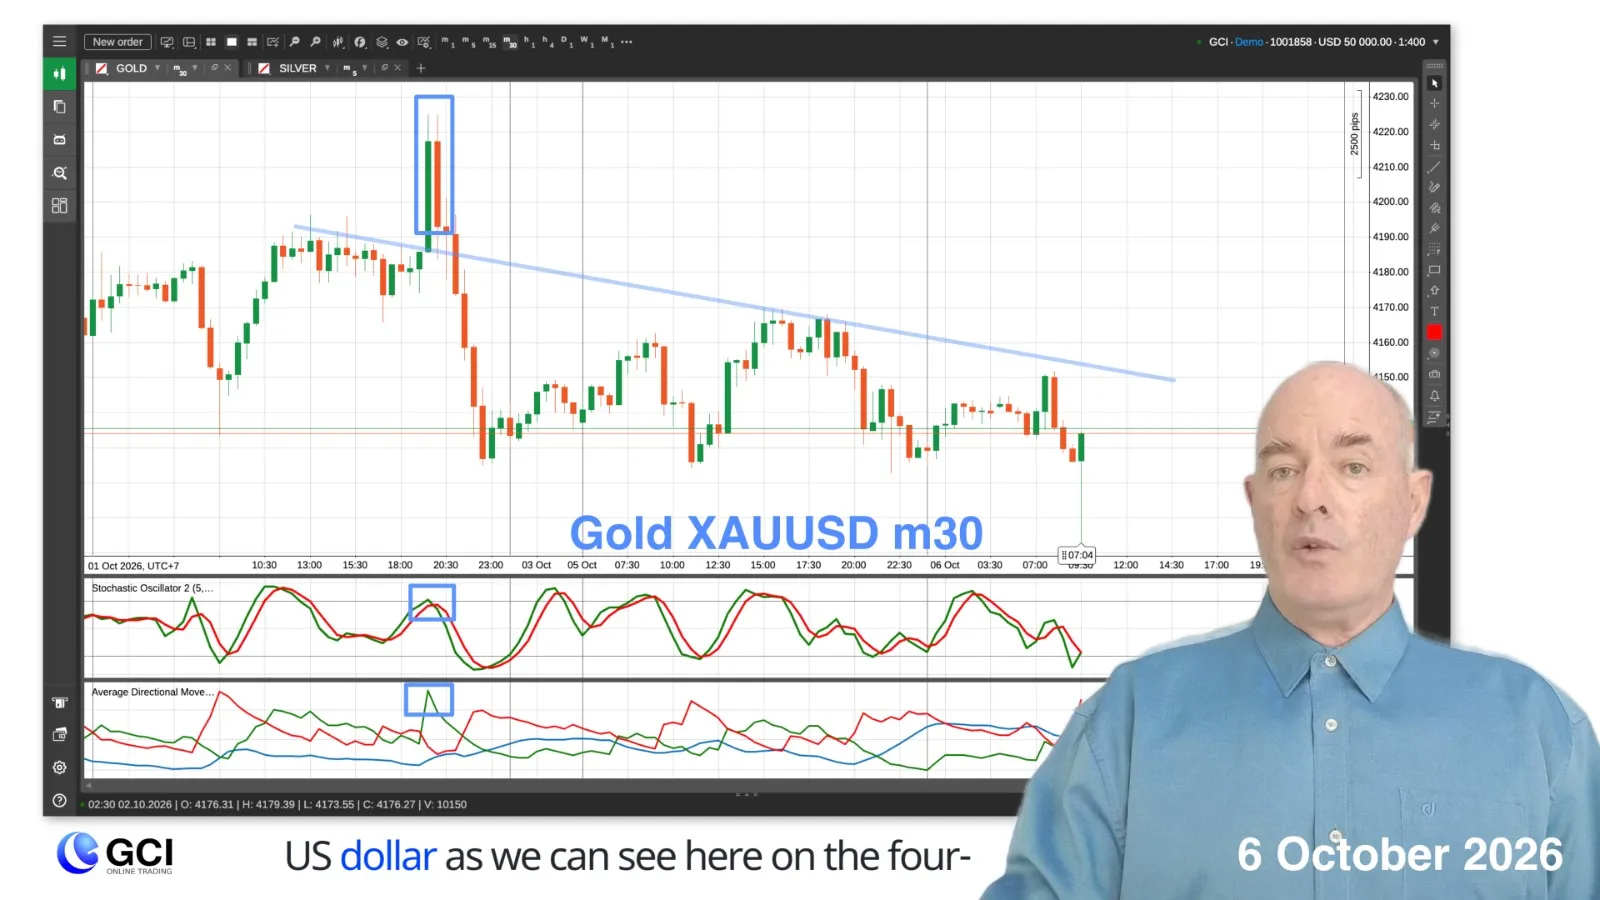
If you like trading gold, the signals have been easy to spot lately, with price action bouncing off this upper trend line in a bear run.
Always trade with that trend, and our indicators help us spot the reversal points.
In today’s Market Outlook, let’s take a look at Forex trading on WTI, Brent crude Oil, GBPUSD, EURUSD, and Gold, XAUUSD.
Just a reminder that these videos are intended as observational and educational, and are not to be considered as trading advice.
So price action on gold is now in a descending triangle.
If we look at a lower time frame, we can see how our indicators, the stochastic oscillator and ADX, picked the tops and bottoms, even with last week’s non-farm payrolls.
Basically, gold is falling based on a stronger USD, as we can see here on the 4-hour EURUSD chart.
The weaker EUR is actually helping to make USD stronger, with investors looking away from political unrest in France and Spain.
Also, US Treasury bill yields are very high, making USD more attractive for investors and driving up USD.
The Fed just raised interest rates last week and is expected to raise them again in October, despite the lower NFP numbers.
And all of the above is being fuelled by geopolitical risk in Iran and the Middle East in general.
So, assuming a stronger USD, we will wait for a bounce off the upper trend line on EURUSD and a reversal of your favourite technical indicators.
GBPUSD is generally bearish as well, but price seems to be consolidating.
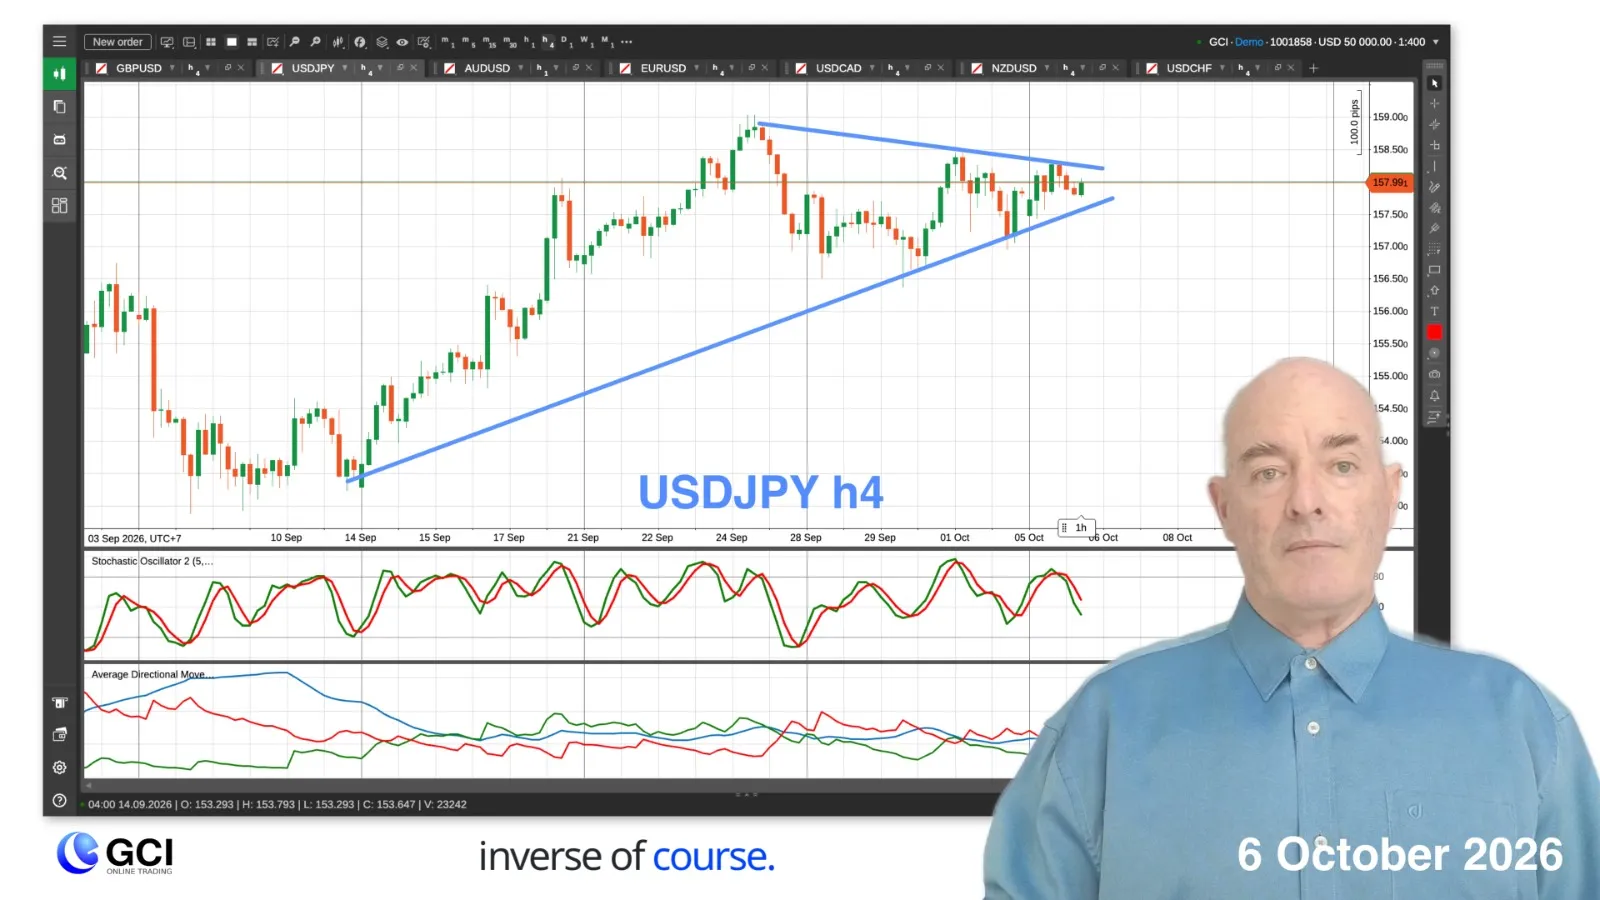
USDJPY is showing a similar chart, but the inverse, of course.
Speaking of Japan, we see the Bank of Japan governor will be speaking today, so watch for volatility and opportunities.
We see an enormous price difference between WTI and Brent Crude Oil of almost $14.
Normally, the spread is about $5, but as we can see, price action on each is going in the opposite direction.
WTI is trending down in a descending triangle while Brent is still trending up in a channel.
The 2 crude oils are now becoming distinct markets, and the US ban on diesel exports has had a big impact, and crude oil supply in the US is strong.
If we look at the bigger picture on WTI, we see price at support from early last month.
But are we seeing a falling wedge?
We may be seeing a rising wedge on Brent, but, as we know, so much depends on the White House and the Iran war.
Again, this is a fundamentals trade, not a technical trade, and the price of Brent Crude depends directly on the amount of crude passing through the Strait of Hormuz and the extar costs.
Also, as you can imagine, transportation and insurance costs have risen to galactic highs, so we are all paying for this, not just the oil.
That’s all for now.
CFDs and FX are leveraged products, and your capital may be at risk.
Latest Analysis
- Gold XAUUSD: 3 Bearish Factors to Watch | Brent vs WTI Divergence & Silver Outlook October 22, 2026 05:07 AM
- GOLD & SILVER BEARISH? EUR GAPS DOWN! October 20, 2026 03:58 AM
- Gold XAUUSD at Resistance! Brent Crude Triangle & Fed Rate Outlook | Forex Trading October 16, 2026 04:24 AM
- Dow Jones Recovery? 4 Key Factors to Watch | US CPI, NASDAQ Resistance & Forex Outlook October 14, 2026 06:18 AM
- Brent Crude Oil Surges on Hormuz Attacks | Dow Jones Weakness, Gold & Forex Outlook October 08, 2026 04:45 AM
- Gold XAUUSD in Descending Triangle & 4 Reasons for USD Strength | WTI vs Brent October 06, 2026 04:33 AM
- NFP Trading: How to Trade the US Non-Farm Payrolls | Gold XAUUSD & USD Outlook October 01, 2026 05:31 AM
- US Indices Under Pressure: 5 Problems to Watch | AUD CPI, USD Strength & Gold Outlook September 29, 2026 04:59 AM
- WTI & Brent Crude Bearish: Real Drop or Fakeout? | US Indices, Gold & Silver Outlook September 24, 2026 04:34 AM
- USD So Strong? 4 Key Reasons | AUDCAD, Gold XAUUSD & Forex Outlook September 22, 2026 03:59 AM
Open an account in minutes
Trade on our award-winning platforms with ultra-fast and ultra-secure execution.
OPEN AN ACCOUNT