Trading News with ADX. Crude Oil in Downtrend?
This Video Shows How to Use Heikin Ashi Candlesticks to Exit Positions Profitably
Good day, Team GCI.
Yesterday we saw USD dip a few times, but the big one was US CPI, which gives the Fed a good idea about inflation.
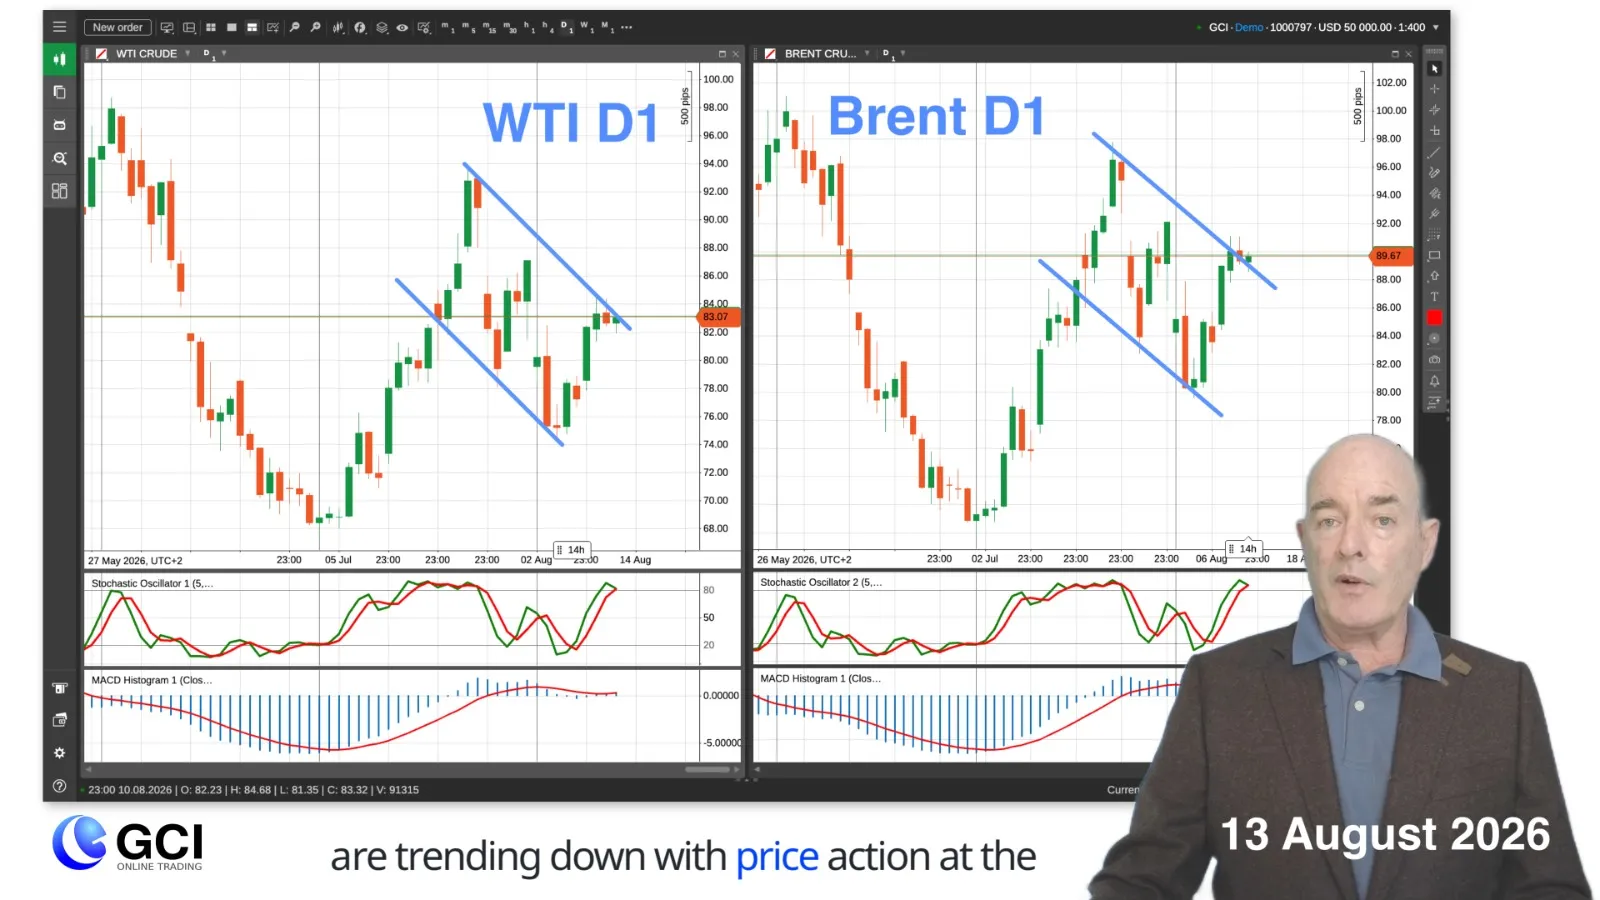
In today’s GCI Market Outlook, let’s take a look at Forex trading on WTI and Brent Crude Oil, and USDCHF.
Just a reminder that these videos are intended as observational and educational, and are not to be considered as trading advice.
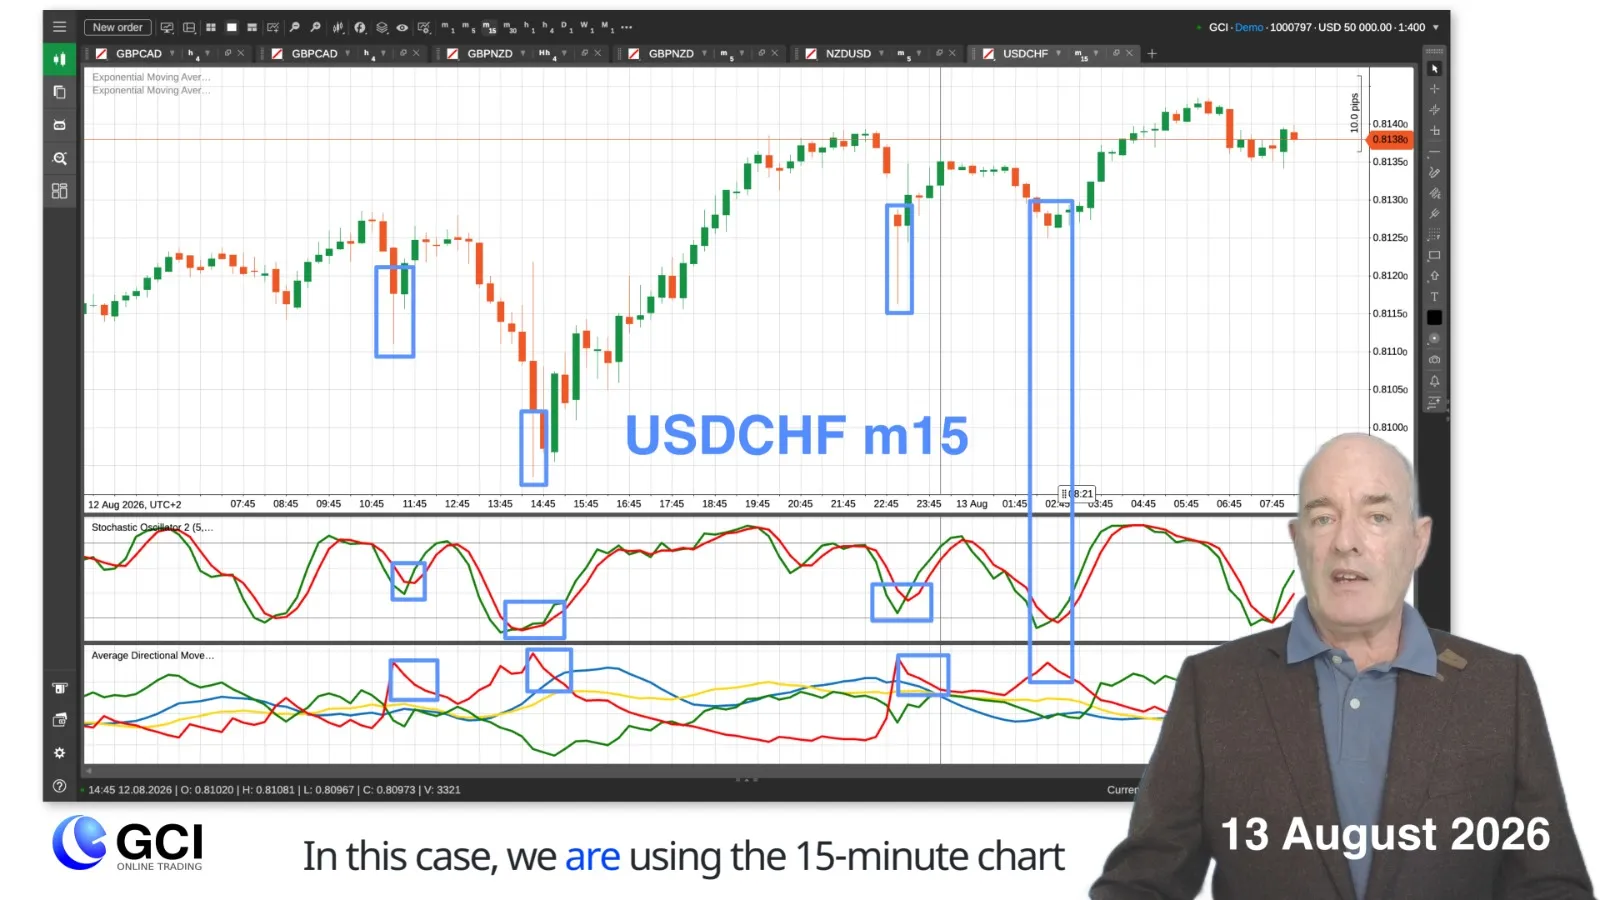
We note at least three dips in USDCHF yesterday, so let’s take a look at how we traded them.
The main event was a scheduled economic news event, the US Consumer Price Index.
You will note on the economic calendar that the actual figures came out exactly as the forecasts.
So why did price action move so much?
These figures, combined with the weak job market and bond yields, told the market that the Fed is even less likely to raise rates next month.
However, as very often occurs with neutral numbers, price action tried to return to normal, and we could take advantage.
This strategy is called the News Catalyst Fade, so let’s take a look at it from the technical side.
As you have seen from hundreds of these videos, my favourite indicator is the stochastic oscillator.
We always try to use it with key levels of support and resistance, trend lines, chart patterns, and perhaps Fibonacci.
But here is an indicator that you may not have tried called ADX or Average Directional Index, which measures the strength of a trend.
The blue line represents the actual strength of the trend, either bullish or bearish; the red line indicates the momentum of bearish trends and the green line indicates the momentum of bullish trends.
Here, we can see what happens when these bearish moves are exhausted.
The red line peaks, then retreats.
Then the stochastic oscillator turning up gives us an entry point.
This happened 3 times yesterday, the most notable being the CPI print, and once today.
In this case, we are using the 15-minute chart and, as always, we look for pullbacks AGAINST the trend so we can open positions WITH the trend.
Or in ranging markets.
So, what about exiting the positions?
One idea, to take the emotion out of watching your trades, is to switch to Heikin Ashi candlesticks.
These present price action in a smoother, more averaged way so you may view the changing characteristics of the candles as the move loses momentum.
Of course, turmoil with USD is not confined to CPI.
The confusing state of the Iran war isn’t helping, and we see WTI and Brent Crude Oil trending down with price at the upper trend line.
That’s all for now.
CFDs and FX are leveraged products, and your capital may be at risk.
Latest Analysis
- Brent Crude Oil Surges on Hormuz Attacks | Dow Jones Weakness, Gold & Forex Outlook October 08, 2026 04:45 AM
- Gold XAUUSD in Descending Triangle & 4 Reasons for USD Strength | WTI vs Brent October 06, 2026 04:33 AM
- NFP Trading: How to Trade the US Non-Farm Payrolls | Gold XAUUSD & USD Outlook October 01, 2026 05:31 AM
- US Indices Under Pressure: 5 Problems to Watch | AUD CPI, USD Strength & Gold Outlook September 29, 2026 04:59 AM
- WTI & Brent Crude Bearish: Real Drop or Fakeout? | US Indices, Gold & Silver Outlook September 24, 2026 04:34 AM
- USD So Strong? 4 Key Reasons | AUDCAD, Gold XAUUSD & Forex Outlook September 22, 2026 03:59 AM
- Brent Crude Oil Drops: 5 Reasons Why | Fed Rate Hike, Gold, GBPJPY & BoJ Outlook September 17, 2026 05:04 AM
- NZDUSD Bearish Outlook: 4 Reasons to Watch | Fed Rate Decision, USD Strength & NASDAQ September 15, 2026 06:21 AM
- ECB Rate Decision & US Inflation Could Move EURUSD | EUR, GBP & Forex Outlook September 10, 2026 05:32 AM
- NFP Shock, $100 Oil & Stronger JPY: What Happens Next? | GCI Market Outlook September 08, 2026 05:21 AM
Open an account in minutes
Trade on our award-winning platforms with ultra-fast and ultra-secure execution.
OPEN AN ACCOUNT